Observability Metrics: Put Your Log Data to Use
How do you think about the success or failure of your coded workflows? Incorrectly defining failure could mean missing absolutely critical failures for days - that’s not fun or business savvy.
The metrics you use to define “success” and “failure” will shape how quickly you respond to issues that could bring critical operations to a grinding halt. Some common criteria include:
- How fresh is your data? At what threshold does data become “stale”?
- How many failures has your workflow produced? How long ago was your last successful run? (The first metric may not be as important - but it enables you to calculate the second.)
- How many runs have you had in a defined period (minute, hour, etc.)? Have these fallen outside their expected threshold?
It’s one thing to define these criteria. It’s quite another to have the tools on hand to implement the alerts based on customer criteria, and then react to and resolve issues the moment they arise. That requires observability. In this article, I’ll talk about the key observability metrics you should be measuring - and how observability can make your workflows more reliable and consistent in the long run.
Observability: More than monitoring and metrics
First, what do I mean by “observability”? You might think, “I have some metrics for my workflows - isn’t that good enough?”
Metrics and monitoring are different than observability. Metrics give you the raw signals by which to set thresholds for success and failure. Monitoring utilizes data collection to gather metrics, aggregate and visualize metrics, and define success/failure criteria in the form of alerts.
Observability goes one step further. It provides the tools you need to see the state of a complex distributed system at any time and dive deep into any reported or suspected issues. It enables you, not only to see the health of your workflow end-to-end at a glance, but to dive into logs, isolate a failure’s root cause, and deploy a fix to get your workflow back up and running. This is just at the single workflow level - observability of a system means you have a holistic understanding of the broad success or failure state of all your workflows, not just an individual one.
What should happen when a workflow fails
Without observability, you may receive alerts about a failure but have no idea how to investigate the cause. This is especially true if the cause is in an upstream or downstream component your team doesn’t own.
For example, let’s say that an API extraction workflow received an HTTP 403 error. In an ideal scenario, the following happens:
- You get an alert about this failure via Slack.
- You can immediately open a dashboard to get a log for the run and isolate which component failed. Your logging is rich enough that it provides an exact error message including what function was called and what data it was handling (minus sensitive data, of course).
- You can see that this failure triggered the backup process you programmed, which performs a bulk load rather than just today’s extraction. This keeps downstream workflows running, which gives you time to debug and fix the root issue.
- Through logging, you discovered that you need to rotate an expired API key. It’s a simple fix and, thanks to the automated backup, you’re all set - downstream workflows are still running and your workflow will perform as expected in tomorrow’s run.
The key observability metrics for workflows
Metrics may not be the sum total of observability. But that doesn’t mean they’re not important. Having the right metrics underlying observability ensures you’re using the right signals to gauge workflow health - and to raise the alarm when something goes sideways.
Prefect’s customers use our workflow orchestration and observability platform to run thousands of critical, distributed workflows. Based on their feedback, we’ve identified three critical metrics that we feature prominently on our customer dashboards: lateness, success rate, and duration.

Let me cover each of these in turn and exactly why they’re so important.
Lateness
Lateness is a measure of how long it’s been since your last workflow run. More precisely, it measures how much your workflow is delayed compared to how often you usually expect it to run. For example, if you expect a successful run at least once an hour and it’s been 1 hour and 18 minutes since the last successful run, your workflow’s running 18 minutes tardy.
Lateness is a critical metric for workflows that run via webhook callbacks (e.g., an AWS Lambda function, a REST API hosted in a Docker container). They can signal that the calling process encountered an error that prevented it from making the HTTP call. These types of errors can be hard to detect in technologies like serverless functions, since it can be difficult to alert on the absence of activity using cloud-based monitoring tools.
Using lateness, you can define a metric and raise an alert if your workflow has failed to run within the defined time period (e.g., the last two hours). This enables you to jump on and fix a problem before users notice it in the form of missing orders or stale report data.
Success rate
Success rate is the percentage of runs that succeeded.
It’s unrealistic to expect that a workflow will be 100% error-free. Transient errors happen (e.g., an external dependency is unavailable due to poor network connectivity or a remote server issue). But with a success rate metric, you can ask and answer:
- What is the average success rate over time?
- Are my workflows staying within this band?
Along with measuring your success rate, it’s important to log all errors in rich detail, including as much information as is appropriate. (This excludes personally identifiable information that your company deems sensitive or is governed by data protection regulations such as GDPR.) With the right level of logging, you can determine which errors are within tolerance and which indicate a deeper problem requiring further investigation and resolution.
Logs should also capture, not just errors from the components you own, but upstream callers, downstream dependencies, and any external services and components to boot. That way, you can pinpoint the cause without spending days chasing down people from other teams.
Duration
Duration is how long it takes your workflow, on average, to run. A sudden change in average runtime can indicate one of a number of issues:
- You’re processing a growing workload, such as a larger queue or a growing volume of data - and you either need to trim the workload or increase the computing resources devoted to processing it
- A code change (e.g., an inefficient SQL query against a database) has caused runtime to spike
- An external dependency (e.g., an API) is either taking longer to respond or failing and requiring multiple retries to succeed
In other words, increased duration can signal either unreliability or an unexpected increase in cost. You can either address this by, for example, turning the workflow into an interactive workflow that requires someone to approve all runs if an increasing number are exceeding the average runtime.
A shorter-than-expected duration can also signal a problem. For example, suppose your workload generally takes 5 minutes to run and is now running at a minute and change. This could signal that an upstream process isn’t sending the right volume of data due to an error on its side. Or it could indicate that your workload’s failed but you’re swallowing the error in a try/catch block.
Observability platform: Making the metrics meaningful
Again, collecting these metrics is necessary but not sufficient. You still need an observability platform to:
- Understand historical behavior via your metrics
- Trigger alerts based on metrics thresholds you’ve set (based on service-level objectives + historical data)
- Know and communicate the impact of issues
- React automatically when issues occur
Prefect is a workflow orchestration and observability platform that enables you to gain deep observability into your workflows no matter where they run. Using Prefect, you can track your workflow components across your infrastructure and issue alerts when the workflow’s lateness, success rate, or duration exceeds your tolerance thresholds. You can then dive into a graph of your workflow, pour through the logs, and isolate the issue quickly - all from an easy-to-use graphical interface. And do this on demand with metric triggers you set - as custom as your workflows.
Alerting on function execution
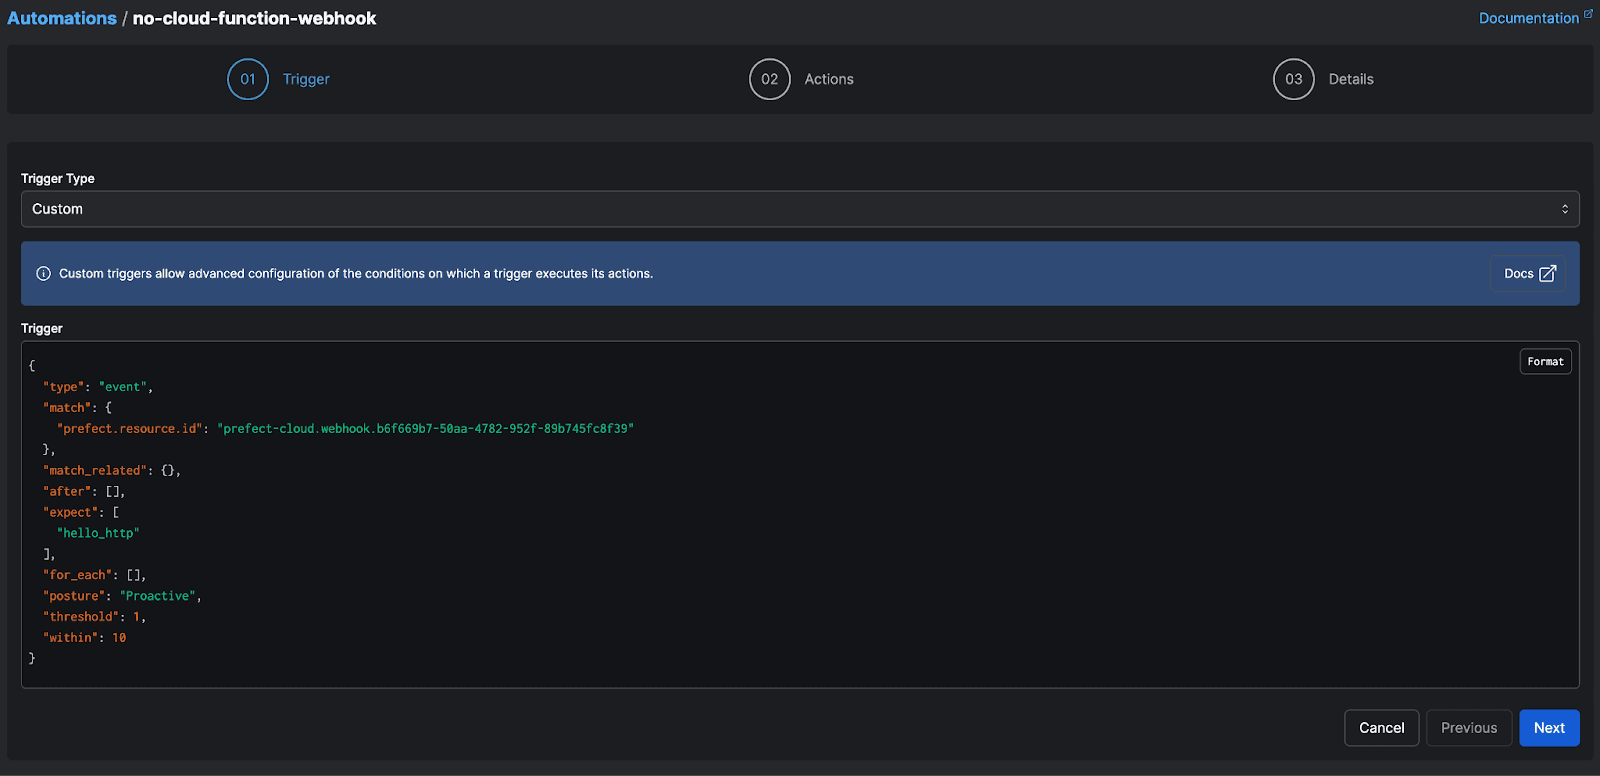
For example, assume you have a critical serverless function running in a cloud provider. You want to get an alert if the function hasn’t fired in the past 30 minutes. Using Prefect, you can create a webhook that receives an event via an HTTP callback from the remote function. You can define the webhook with a proactive posture, meaning you’ll want to generate an alert in the absence of activity. The example below shows a callback that should receive one call every 10 seconds:

Alerting on a specific workflow metric
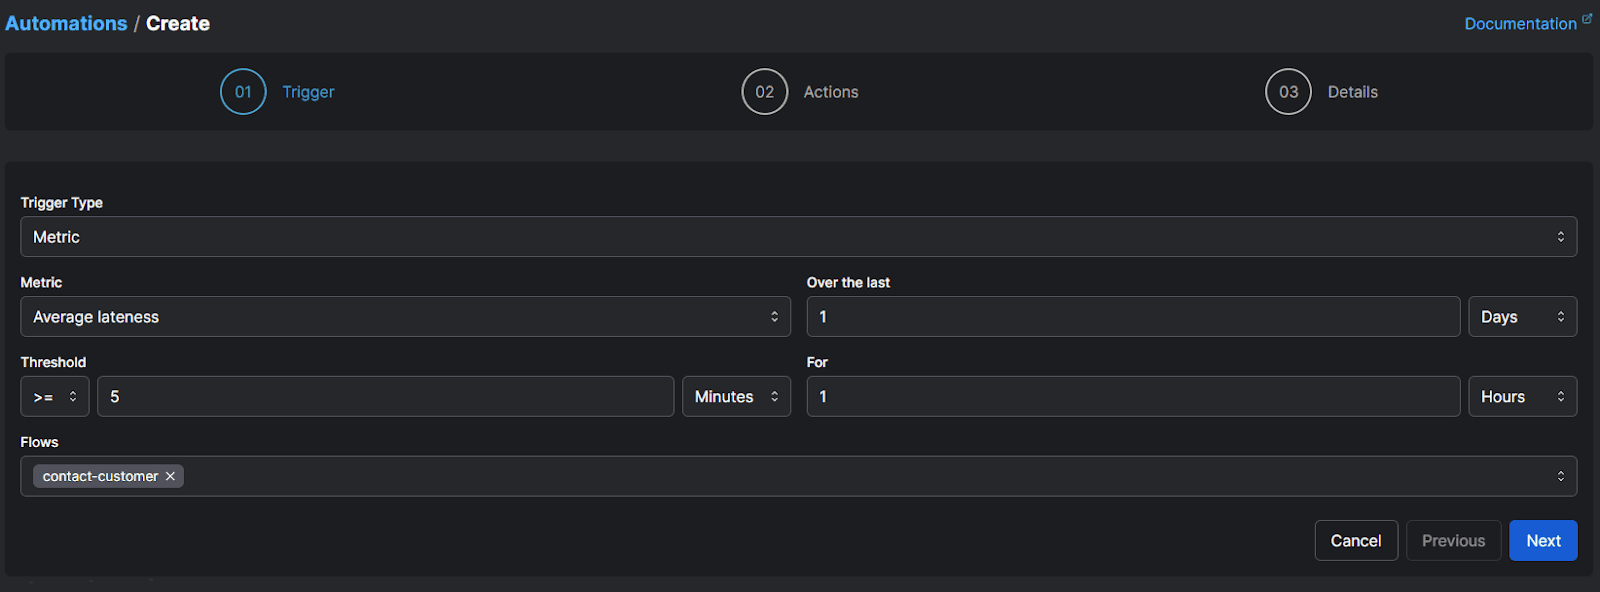
You can also define a metrics trigger that fires if a flow meets certain threshold criteria. For example, the automation below will run if the flow runs an average of 5 minutes late over the last hour:

You can also use Prefect to define your own complex workflows that orchestrate distributed resources. Prefect enables defining workflows as flows that you can divide into distinct tasks, which you can use to divide and isolate each step in your workflow for enhanced visibility. You can then track observability metrics and logs for that workflow from a single, centralized location.
For example, you could use Prefect to orchestrate an order processing workflow that consisted of ingesting a Kafka event, making an API call to the order fulfillment system, and sending a confirmation e-mail to a customer. If an error occurs in any one of these steps, you can find and debug it quickly without needing to hunt down logs across three separate systems.
Want to see how Prefect can give you greater visibility into your complex workflows? Create a free account and run the first tutorial.
Related Content


