Building an Application with Hashboard and Prefect
A Snow Leaderboard
Building data applications does not have to be a slog. Modern tooling enables you to create lightweight applications that process and respond to large amounts of data and require minimal maintenance, especially when you want to be on top of the latest snowfall this ski season!
This post walks through building a leaderboard for snowfall at ski resorts in the U.S., powered by Hashboard and Prefect. The leaderboard uses up-to-date data that winter sports enthusiasts can use to track winter storms and see where the snow is falling; the application portion responds to specific events like huge powder days and triggers notifications to specific individuals. Relying on the National Gridded Snowfall Analysis dataset, it only took a couple days to build an end-to-end leaderboard with an interactive frontend and API-driven backend. Check out the Snow Leaderboard and keep reading to discover how we built a lightweight yet fully-featured data application.
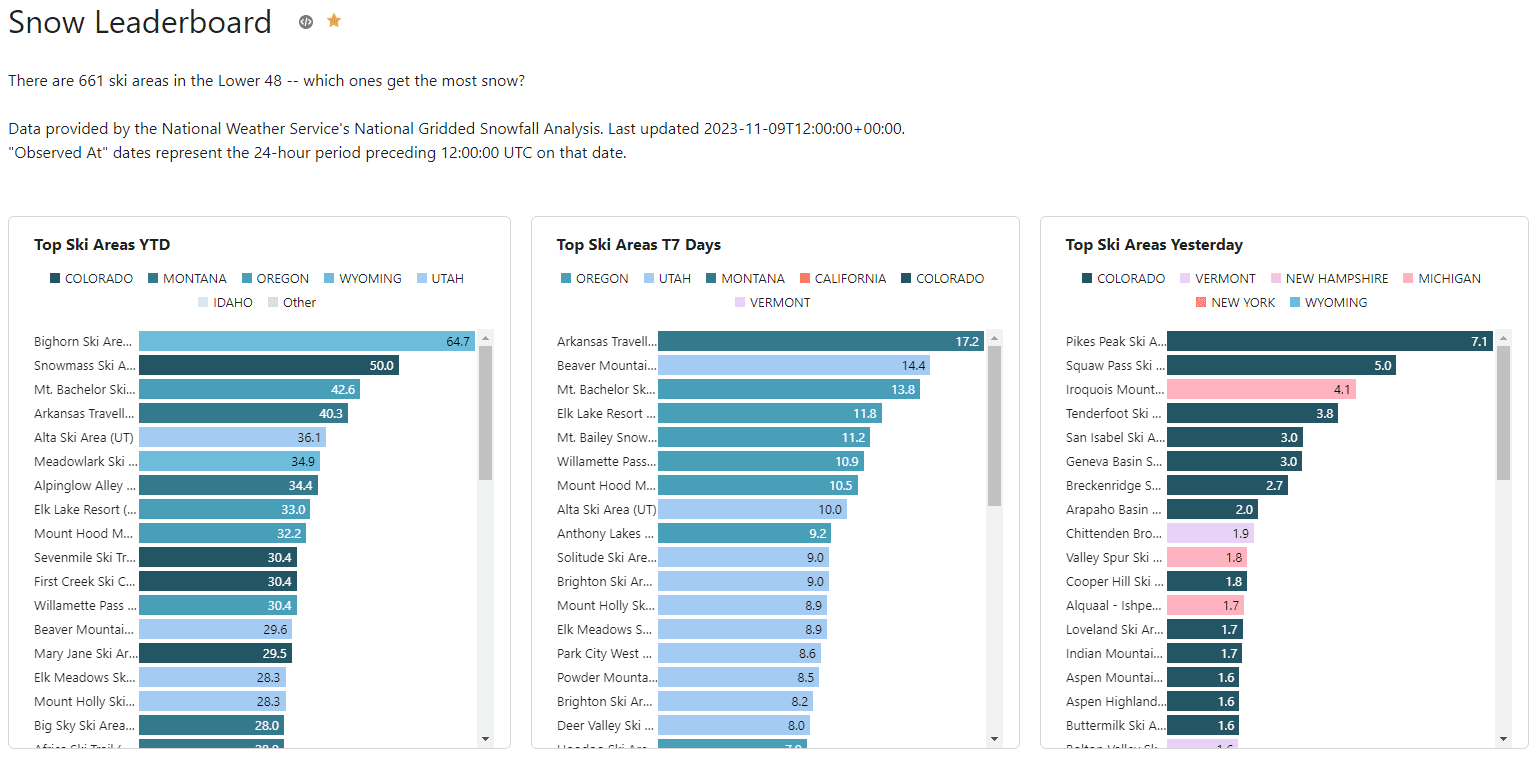
Screenshot of the Snow Leaderboard dashboard in Hashboard
Breaking down an application into steps
To achieve the interactive and useful snow leaderboard we envisioned, we needed to:
- Create an engaging analysis of recent snowfall data.
- Develop an automated pipeline to extract, transform, and load the data.
- Host the ETL pipeline on a serverless worker that could scale down to zero.
- Implement an orchestrator for observability, alerting, and other automations.
Let’s look at how we solved for each objective:
1. Create an engaging analysis of recent snowfall data.
Hashboard’s excellent visualization capabilities, paired with its built-in semantic modeling, meant it would be easy to develop engaging metrics and charts. With Hashboard, we could make simple lists of the snowiest places alongside faceted visualizations of year-over-year comparisons. We can also use Hashboard's BI-as-code features to integrate maintenance into our upstream pipeline. Hashboard is data warehouse-native, but for a small application like this we can use its DuckDB-powered features to query uploaded files.
2. Develop an automated pipeline to extract, transform, and load the data.
Hashboard allows you to upload data in the form of CSV, JSON, or Parquet files, and then model and query that data using DuckDB. If we could get the snowfall data into one of those formats, we could use the Hashboard CLI to upload the data.
The raw data is provided by the National Weather Service as GeoTIFF files, available in a directory over HTTP. We decided to use Python to download the files, extract structured data from the GeoTIFFs, and save that structured data as Parquet files (both locally and on S3).
3. Host the ETL pipeline on a serverless worker that could scale down to zero.
This pipeline would only need to run for 1-2 minutes per day – the perfect use case for a serverless worker or batch job runner (read more context about serverless here). Due to the simplicity of our requirements, we chose to run the daily jobs using a GitHub Actions Workflow, triggered by a cron schedule.
4. Implement an orchestrator for observability, alerting, and other automations.
Running a pipeline on a remote worker starts simple but grows in complexity when considering Python package requirements, failure recovering, monitoring, retries, and more. We chose Prefect due to its expressive Python API, its beautiful hosted dashboard on Prefect Cloud, and its ability to react to pipelines using automations. And while Prefect includes a scheduler, it also works great when jobs are scheduled by another service, as we’re doing here with GitHub Actions. Prefect’s observability and visualization is a critical step in developing and deploying our code.
You can view all of the code for this project in the Hashboard Examples repo on GitHub.
Data Transformation & Orchestration
Creating the Ski Locations Dimension
See snow_leaderboard/src/etl/extract_ski_locations.py for the full script.
The first step would be to download a tarball from NOAA with every ski resort, its name, state, and lat/long coordinates, and extract GIS shapefiles from the tarball archive. We wrote a function to do that, and wrapped it in Prefect’s @task decorator, to enable a single retry in case of a network failure:
1@task(retries=1)
2def download_and_extract_file() -> Path:
3    url = "https://www.nohrsc.noaa.gov/data/vector/master/ski_areas_all.tar.gz"
4    directory = get_local_dir_for_location_data()
5    shp_file = "ski_areas_all.shp"
6    with TemporaryDirectory() as tmp:
7        p = download_file_from_url(url, Path(tmp))
8        with tarfile.open(p) as archive:
9            archive.extractall(directory)
10    return directory / shp_file
Next, we used DuckDB with the spatial extension to open the shapefile, do some light transformation, and export the data to a parquet file. In particular, we use a DuckDB SQL query to create a unique key, deduplicate the source data, filter out some bad data, and join an in-memory dataframe with state code lookups. We again wrap this with @task, so we see this step in our Prefect workflow.
1@task
2def convert_shp_file_to_parquet(shp_file: Path) -> Path:
3    states_df = pd.DataFrame.from_records(STATES)
4    states_df.columns = ("state_name", "state_code")
5
6    conn = duckdb.connect()
7    conn.execute("install spatial; load spatial;")
8    # there are a small number (~4) of duplicate resorts with slightly different
9    # coordinates; we filter out the bad ones and average the others
10    cur = conn.sql(
11        f"""
12        select distinct
13            md5(ski_areas.name || '-' || ski_areas.state) as id,
14            ski_areas.name || ' (' || states_df.state_code || ')' as "NAME",
15            ski_areas.state,
16            avg(ski_areas.lat) over (partition by id) as lat,
17            avg(ski_areas.long) over (partition by id) as long
18        from st_read('{shp_file}') as ski_areas
19        join states_df on ski_areas.state = states_df.state_name
20        where
21            ski_areas.type in ('Alpine', 'Both')
22            ... -- other data quality filters
23    """
24    )
25    p = shp_file.with_suffix(".parquet")
26    cur.write_parquet(str(p), compression="snappy")
27    return p
Finally, we wrote a task function that uploads the parquet file to S3, so it’s easy for a worker to retrieve later. We put those three tasks in sequence using another function, this time wrapped as a Prefect @flow. We also use Prefect’s flow run logger to log the location of the dataset when it is written to S3:
1@flow
2def create_ski_locations_dataset() -> None:
3    shp_file = download_and_extract_file()
4    pq_file = convert_shp_file_to_parquet(shp_file=shp_file)
5    s3_uri = upload_parquet_to_s3(pq_file=pq_file)
6    logger = get_run_logger()
7    logger.info("Created ski resort parquet file at %s", s3_uri)
Running the flow is as easy as calling the function, which we can do from the command line by executing our script. Prefect’s logging streams updates as the flow progresses:
1$ python src/etl/extract_ski_locations.py
214:01:57.829 | INFO    | prefect.engine - Created flow run 'exotic-mongrel' for flow 'create-ski-locations-dataset'
314:01:57.834 | INFO    | Flow run 'exotic-mongrel' - View at https://app.prefect.cloud/account/6aa64ff2-f0e8-4215-9e50-d588a71bc1d1/workspace/0c26717b-0657-4817-9811-43e9a1193233/flow-runs/flow-run/9543bd7d-6069-4760-8278-c2bf576d87e0
414:01:58.203 | INFO    | Flow run 'exotic-mongrel' - Created task run 'download_and_extract_file-0' for task 'download_and_extract_file'
514:01:58.206 | INFO    | Flow run 'exotic-mongrel' - Executing 'download_and_extract_file-0' immediately...
614:01:59.805 | INFO    | Task run 'download_and_extract_file-0' - Finished in state Completed()
714:01:59.962 | INFO    | Flow run 'exotic-mongrel' - Created task run 'convert_shp_file_to_parquet-0' for task 'convert_shp_file_to_parquet'
814:01:59.964 | INFO    | Flow run 'exotic-mongrel' - Executing 'convert_shp_file_to_parquet-0' immediately...
914:02:00.596 | INFO    | Task run 'convert_shp_file_to_parquet-0' - Finished in state Completed()
1014:02:00.719 | INFO    | Flow run 'exotic-mongrel' - Created task run 'upload_parquet_to_s3-0' for task 'upload_parquet_to_s3'
1114:02:00.721 | INFO    | Flow run 'exotic-mongrel' - Executing 'upload_parquet_to_s3-0' immediately...
1214:02:01.967 | INFO    | Task run 'upload_parquet_to_s3-0' - Finished in state Completed()
1314:02:01.971 | INFO    | Flow run 'exotic-mongrel' - Created ski resort parquet file at s3://snow-leaderboard-dev/ski_locations/ski_areas_all.parquet
1414:02:02.136 | INFO    | Flow run 'exotic-mongrel' - Finished in state Completed('All states completed.')
We can click the provided link to view the flow run in the Prefect Cloud UI:
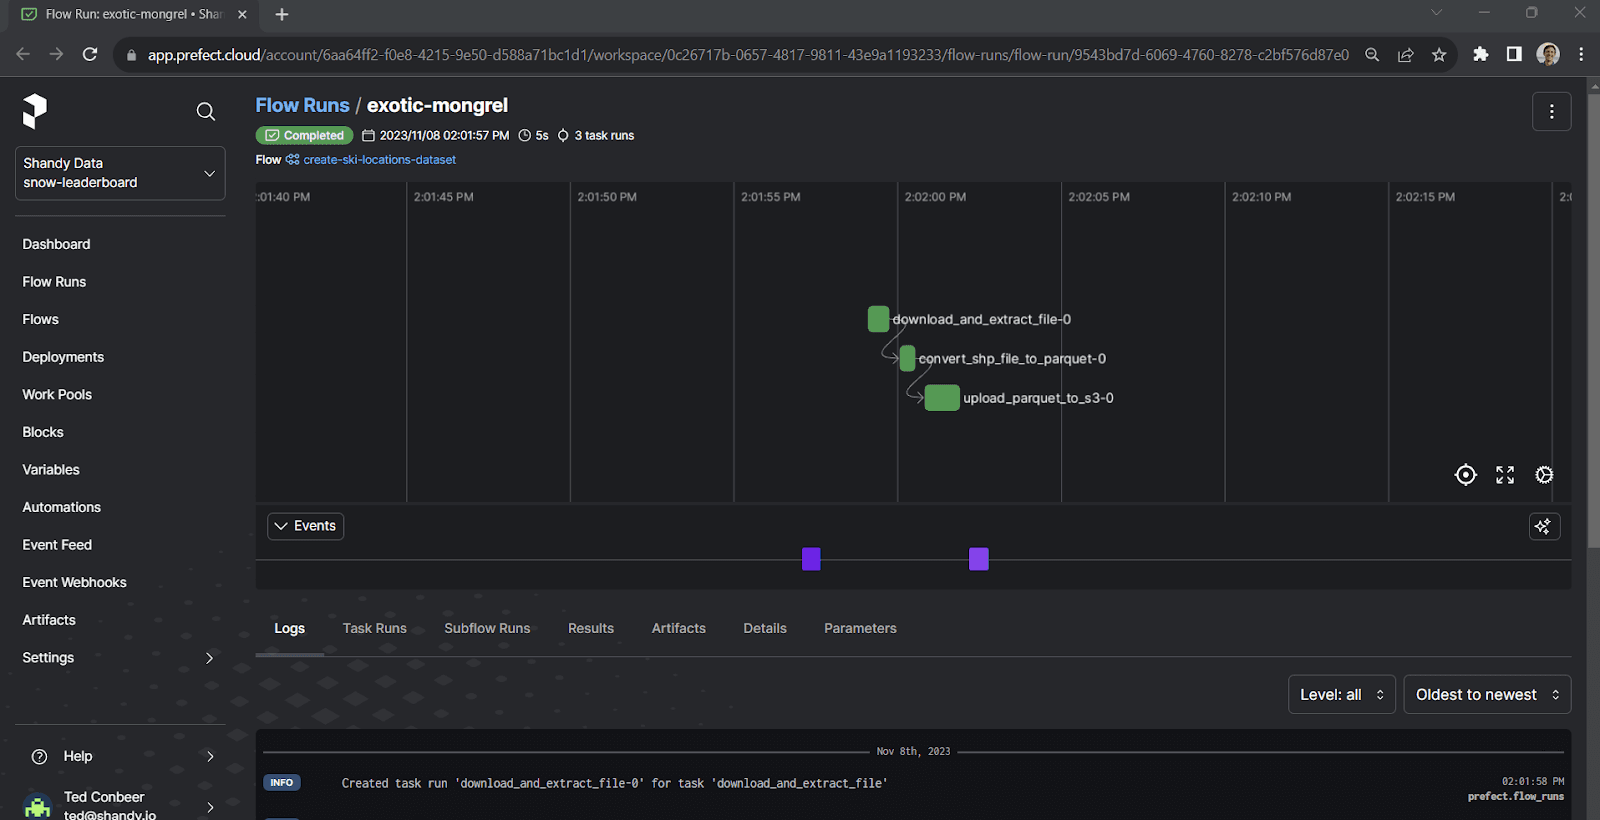
Creating the Daily Snowfall Dataset Asynchronously
See snow_leaderboard/src/etl/extract_daily_data.py for the full script.
This flow is a bit more complex. Let’s look at the completed flow, and break down the parts after:
1@flow
2def create_daily_dataset(partition: date) -> None:
3    logger = get_run_logger()
4    logger.info("Creating dataset for %s", partition.isoformat())
5
6    # Retrieve and back up raw data
7    tiffs = download_daily_tiffs(partition=partition)
8    if any(isinstance(result, HTTPError) for result in tiffs):
9        logger.error("GeoTIFFs unavailable for %s", partition)
10        return
11
12    s3_keys = upload_tiffs_to_s3(tiffs)
13    logger.info("Uploaded tiffs to s3 at %s", s3_keys)
14
15    df = transform_tiffs_to_df(partition=partition, tiffs=tiffs)
16    logger.info("Created df with shape %s", df.shape)
17
18    parquet_file = write_df_to_parquet(partition=partition, df=df)
19    logger.info("Saved DF to %s", parquet_file)
20
21    s3_uri = upload_parquet_to_s3(partition=partition, local_path=parquet_file)
22    logger.info(f"Uploaded file to s3: {s3_uri}")
23
The first thing to notice is that this flow is parametrized by a date that we call the partition. Parametrizing a flow is as simple as giving the function an argument. We do this so that we can run this flow to create the data for any individual day, and as we see later, we can call this flow directly or from another higher-level flow to backfill data for many days.
Downloading GeoTIFF Data Concurrently in Prefect
This flow calls other flows (called subflows), simply by calling the Python function – no special syntax needed. The first of these subflows is download_daily_tiffs, which is also parametrized by the partition. In this subflow, we use the partition to build the URLs to the daily and seasonal (year-to-date) datasets for that date:
1@flow
2def download_daily_tiffs(partition: date) -> tuple[Path | HTTPError, Path | HTTPError]:
3    BASE_URL = "https://www.nohrsc.noaa.gov/snowfall_v2/data/"
4    year_and_month = f"{partition.year}{partition.month:02}/"
5    daily_filename, season_filename = get_tiff_filenames_for_partition(
6        partition, utc_time="12"
7    )
8
9    daily_url = f"{BASE_URL}{year_and_month}{daily_filename}"
10    season_url = f"{BASE_URL}{year_and_month}{season_filename}"
11    futures: list[PrefectFuture] = []
12    for url in [daily_url, season_url]:
13        futures.append(download_tif.submit(url))
14    return tuple(f.result(raise_on_failure=False) for f in futures)
In the download_daily_tiffs subflow, we call a simple task named download_tif. However, instead of calling the task directly, we use the task’s submit method, which asynchronously queues the task and returns a future representing its state and result. This allows us to download multiple files in parallel. Task.submit is one of the very nice features of Prefect – we can write an ordinary, synchronous Python function and effortlessly execute it in a non-blocking manner.
In this case, we also suppress any exceptions raised by download_tif and return them to our main flow instead; this is because the create_daily_dataset flow might be called with a partition before its snowfall data is available; in that case, we want the flow to return as a no-op, instead of raising an exception, so that it does not interrupt calling flows.
Extracting Structured Data from GeoTIFF

What sets GeoTIFF apart is that it also includes metadata that maps each pixel of the image to coordinates on the Earth. For this project, we found the Python library rasterio, which makes it easy to interact with GeoTIFFs.
To get the data for a single coordinate, you can use rasterio’s sample method:
1import rasterio
2with rasterio.open("snow.tif") as daily_dataset:
3    daily_dataset.sample(x=-106.38, y=39.61)
In our transform_tiffs_to_df subflow, we first use DuckDB to query the locations dataset and build a list of coordinates for all ski resorts. We then iterate over that list and use sample to extract the daily and year-to-date snowfall from the two GeoTIFFs, which we store in a Pandas DataFrame (and eventually write to Parquet and back up to S3).
Concatenating Daily Datasets
See snow_leaderboard/src/etl/transform_season_data.py for the full script.
So far, we’ve looked at the process for creating daily datasets, which are individual Parquet files with a single day’s snowfall data. To make these easier to work with, we want to concatenate each season’s days into a single Parquet file. Fortunately, DuckDB makes this really easy! In the concatenate_season_data flow (which takes the season year as a parameter), we use DuckDB to query all parquet files in a folder and write them to a single file. The relevant lines are:
1# def concatenate_season_data(...):
2cur = conn.sql(
3    f"""
4    select id as location_id, observed_at, snowfall_24h, snowfall_ytd
5    from '{source_uri}/*.parquet'
6    where snowfall_24h >= 0.0 -- negative values used for null
7"""
8)
9cur.write_parquet(file_name=dest_uri, compression="snappy")
Visualizing with Hashboard
Loading Data Using The Hashboard CLI
See snow_leaderboard/src/etl/load_hashboard.py for the full script.
Hashboard provides a CLI that enables programmatic management of your Hashboard instance and the resources it defines, like Dashboards and Metrics.
The CLI provides a command for uploading data to Hashboard. We’ll use it to upload each season’s parquet file:
hb upload <path>
It also allows you to manage the internal cache for your semantic data models; after uploading new data, we clear the cache for our snowfall model with:
hb cache clear <model GRN>
To call the CLI from Python, we simply use the subprocess module, so our upload command becomes:
subprocess.run(["hb", "upload", str(local_path)])
We wrap this upload call in another @flow, for easy integration into the rest of our ETL workflow.
Updating a Dashboard Filter Programmatically
See snow_leaderboard/src/etl/update_dashboard_filter.py for the full script.
Of course, our dashboard will now show new data when it’s loaded, but with Hashboard we can take things a step farther.
Using Hashboard’s CLI, we can programmatically change anything about the dashboard, including interactive configurations, like the values of dashboard filters.
The second section of our dashboard highlights a single resort and shows top powder days and year-over-year trends:
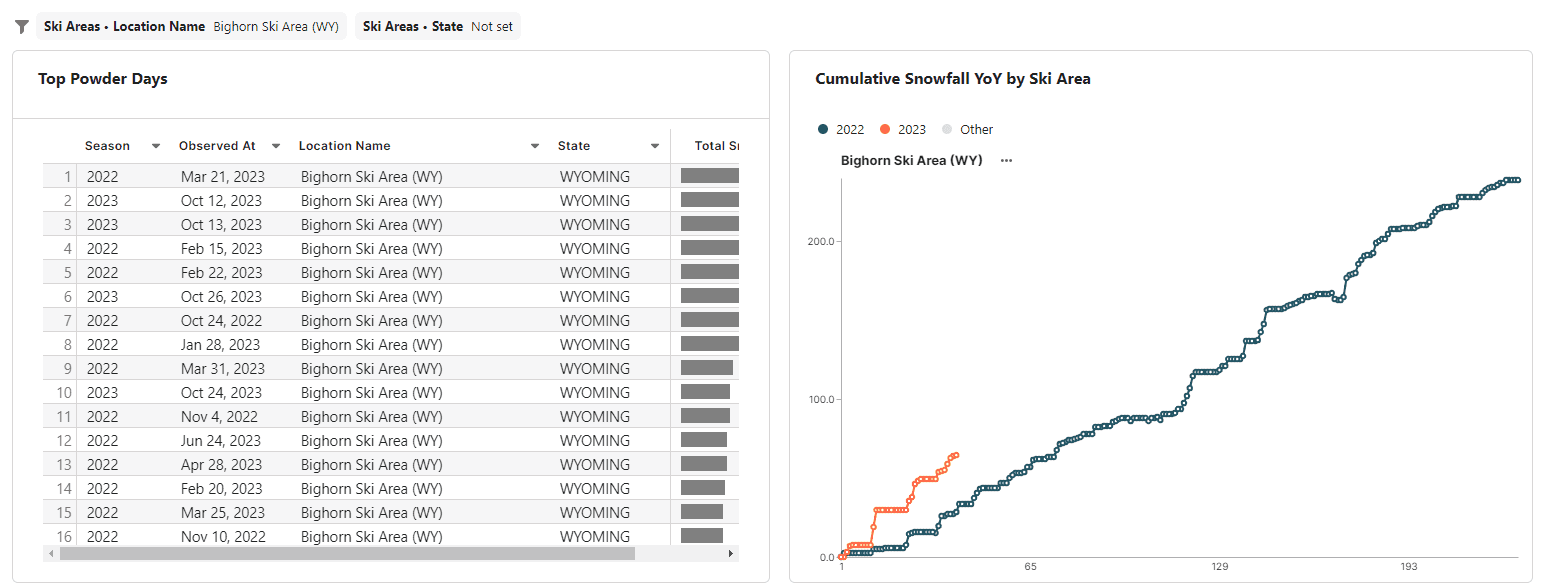
Wouldn’t it be nice if that section always showed the resort with the most snowfall, by default?
With most BI tools, you would have to decide between providing a user-editable filter, or creating a new data model that only included this information for a specific resort. With Hashboard, you don’t have to choose.
We create a new flow that queries our season dataset for the resort with the most snowfall. We then use the Hashboard CLI to pull down YAML config files of the current state of the deployed dashboard:
subprocess.run(["hb", "pull", "--all"], cwd=str(VIZ_DIRECTORY))
yaml = YAML(typ="rt")
dashboard_path = VIZ_DIRECTORY / "dsb_snowleaderboard.yml"
dashboard_config = yaml.load(dashboard_path)
Now we can simply update the value in the dashboard_config dictionary, dump the dict back to a YAML file, and deploy the updated dashboard.
yaml.dump(dashboard_config, dashboard_path)
subprocess.run(["hb", "deploy", "--no-preview"], cwd=str(VIZ_DIRECTORY))
Orchestration, Backfill, and Automation with Prefect
Backfilling Daily Datasets
See snow_leaderboard/src/etl/__init__.py for the full script.
Because we parameterized the create_daily_dataset flow in Prefect, it’s easy to run that flow in a loop for any range of dates we like, and then run concatenate_season_data and load_season_to_hashboard immediately after that. We define two new flows, backfill_all_daily_datasets_in_season and update_current_season, which do just that. update_current_season is designed to be run daily; our source data can be updated for up to five days after a snowfall event, so we run create_daily_dataset for today’s date and the prior 5 days (although the number of days is configurable):
1@flow
2def update_current_season(delta: timedelta = timedelta(days=5)) -> None:
3    """
4    Snow data may be updated for up to 5 days after the observation date.
5
6    delta (timedelta): The delta before today to update. Defaults to 5 days.
7    """
8    start_date = today() - delta
9    end_date = today() + timedelta(days=1)  # exclusive
10    days = (end_date - start_date).days
11    for i in range(days):
12        create_daily_dataset(start_date + timedelta(days=i))
13    season = get_season_of_partition(partition=end_date)
14    concatenate_season_data(season=season)
15    load_season_to_hashboard(season=season)
16    update_dashboard_filter(season=season)
After running this flow, we can view it, along with all of its nested subflows and tasks, in the Prefect Cloud UI:
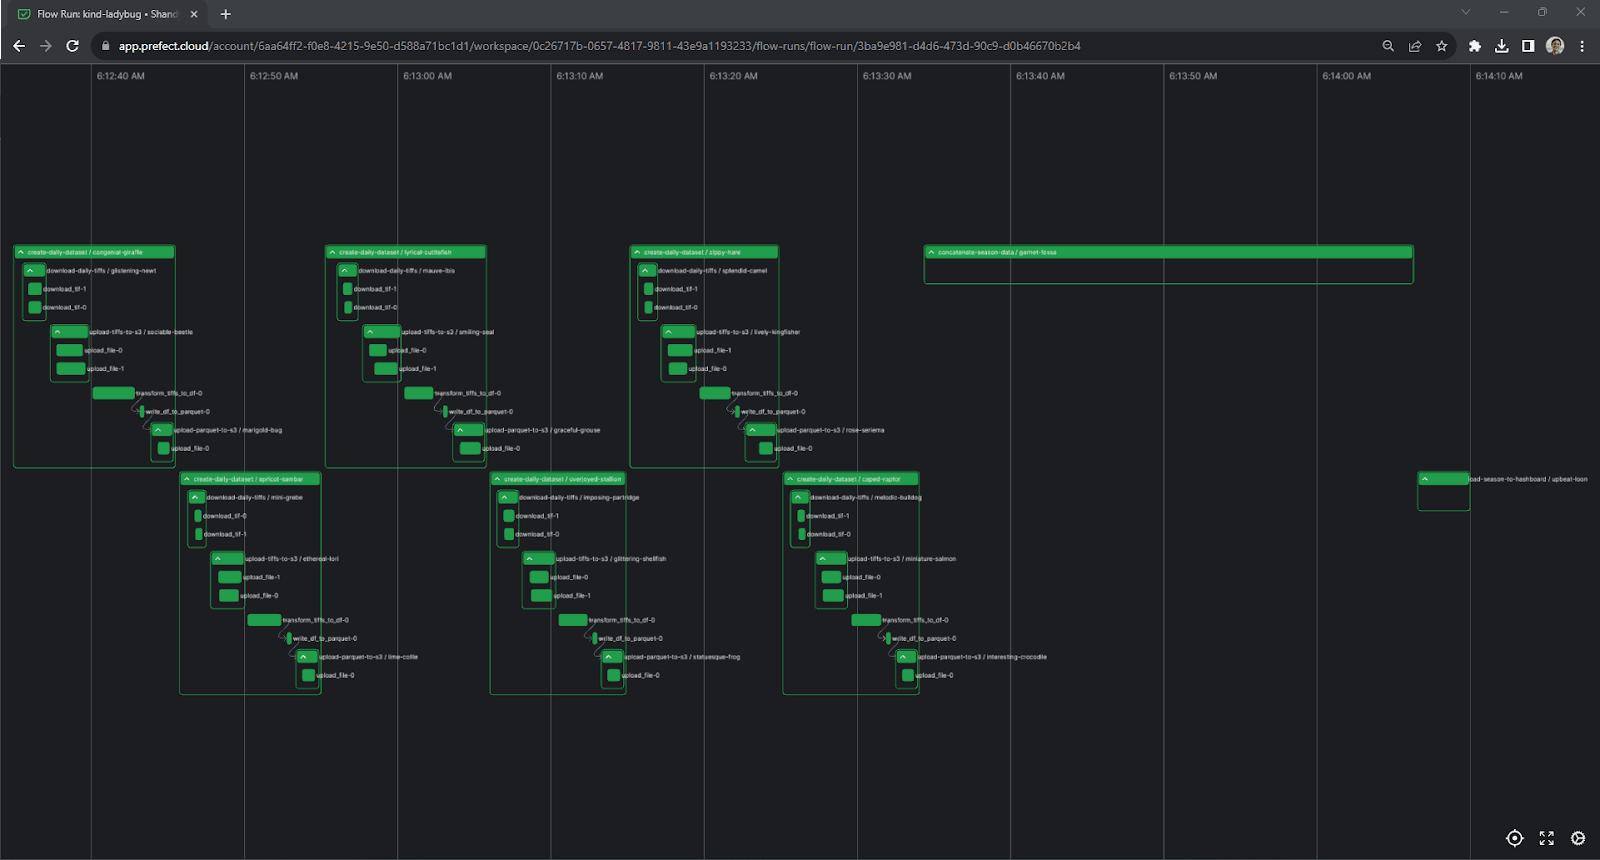
A screenshot of the Prefect Cloud UI, showing a chart of the update_current_season flow
Finally, we create a __main__.py file to make update_current_season the main entrypoint for our etl module:
from etl import update_current_season
update_current_season()
Running on a Schedule with GitHub Actions
See .github/workflows/snow_leaderboard_etl.py for the full script.
After developing our flows and running them locally, it was time to deploy them to a serverless worker that could run on a schedule. Since we already use GitHub, that was as simple as creating a .github directory in the root of our repo, and then creating a .yml file in the workflows subdirectory.
The first part of the workflow definition sets its triggers, which are a simple schedule, in addition to a manual invocation through the GitHub UI:
on:
workflow_dispatch:
schedule:
- cron: '0 13 * * *'
Next, we define the runner type, check out the repo, and install Python and this project’s dependencies (using Poetry). Finally, we run the update_current_season flow by invoking the etl module with python -m etl. Authentication is handled through environment variables that are loaded from GitHub Actions Secrets:
- name: Run ETL pipeline
run: poetry run --directory snow_leaderboard python -m etl
env:
AWS_ACCESS_KEY_ID: ${{ secrets.AWS_ACCESS_KEY_ID }}
...
We merge our branch with the .yml file to main, and we’re done! We can verify the workflow by invoking it from the GitHub UI:

Screenshot of the GitHub actions UI, showing a “Run Workflow” button
We can either follow along in the GitHub Actions logs, or in the Prefect Cloud UI.
Enabling Notifications Using Prefect Automations
See snow_leaderboard/src/etl/check_for_powder.py for the full script.
Now that we’ve built our dashboard and deployed our pipeline, it’s time to add one last feature: automated notifications for big powder days at the resorts we care about.
While we could roll our own email or Slack notification, Prefect Cloud provides integrations and blocks that make this much easier. All we have to do is emit an event from a flow:
1@flow
2def check_for_powder_day(season: int) -> None:
3    resorts = [...]
4    latest_snowfall = get_latest_snowfall_for_resorts(resorts=resorts, season=season)
5    for resort, snowfall in latest_snowfall:
6        if snowfall >= 6.0:
7            emit_event(
8                event="powder_day",
9                resource={"prefect.resource.id": "snowfall"},
10                payload={"resort": resort, "snowfall_24h": snowfall},
11            )
Next, we can create an Automation in the Prefect Cloud UI. Automations respond to triggers and perform actions. We can create a custom trigger for our new event on the snowfall resource:
1{
2  "match": {
3    "prefect.resource.id": "snowfall"
4  },
5  "match_related": {},
6  "after": [],
7  "expect": [],
8  "for_each": [
9    "prefect.resource.id"
10  ],
11  "posture": "Reactive",
12  "threshold": 1,
13  "within": 0
14}
There is a built-in action type for sending notifications using blocks to send a Slack, Teams, or email message (among other options). We can use the properties of our event in the message:
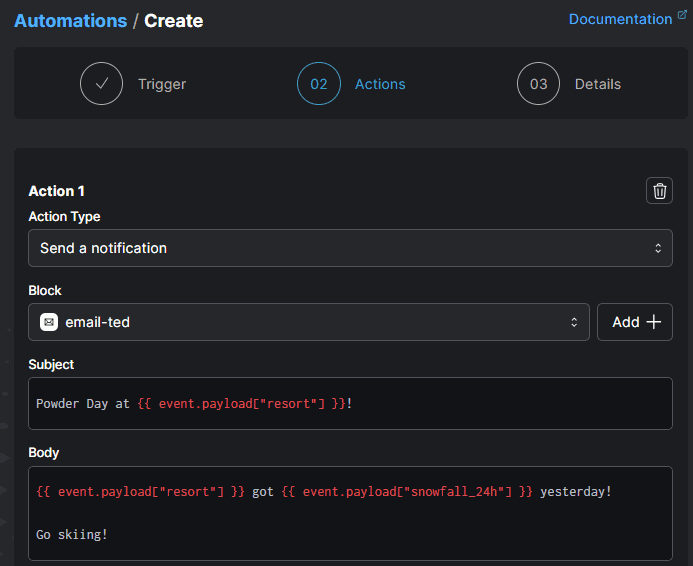
Screenshot of the Prefect Cloud UI, showing a configured action to send an email on powder days
Finally, we add a call to our check_for_powder_day flow in our main update_current_season flow, and we’ll be notified when it’s time to go skiing.
Automations can be used as notifications or to trigger other flows—in the case of the snow leaderboard, they provide the final step to being pinged about powder days.
The power of applications
We built the Snow Leaderboard using Hashboard and Prefect (along with DuckDB, rasterio, GitHub Actions, and others!) with the approach of a modern data application with a UI and an API-driven backend. This allowed us to build an interactive tool, powered by data, that was observable upon failure and understandable.
If you have a friend who likes skiing, please share the dashboard with them. If you’re interested in learning more about Hashboard, you can sign up for a 30-day free trial and check out the docs. To learn more about Prefect, sign up for a free Prefect Cloud account and get started with the docs.
Prefect makes complex workflows simpler, not harder. Try Prefect Cloud for free for yourself, download our open source package, join our Slack community, or talk to one of our engineers to learn more.
Related Content


